Part of the OpX Platform

See Problems. React Faster. Deliver Plan.
A simple Andon and Takt Time system for manual assembly and production lines, using phones, local dashboards and real-time line visibility.
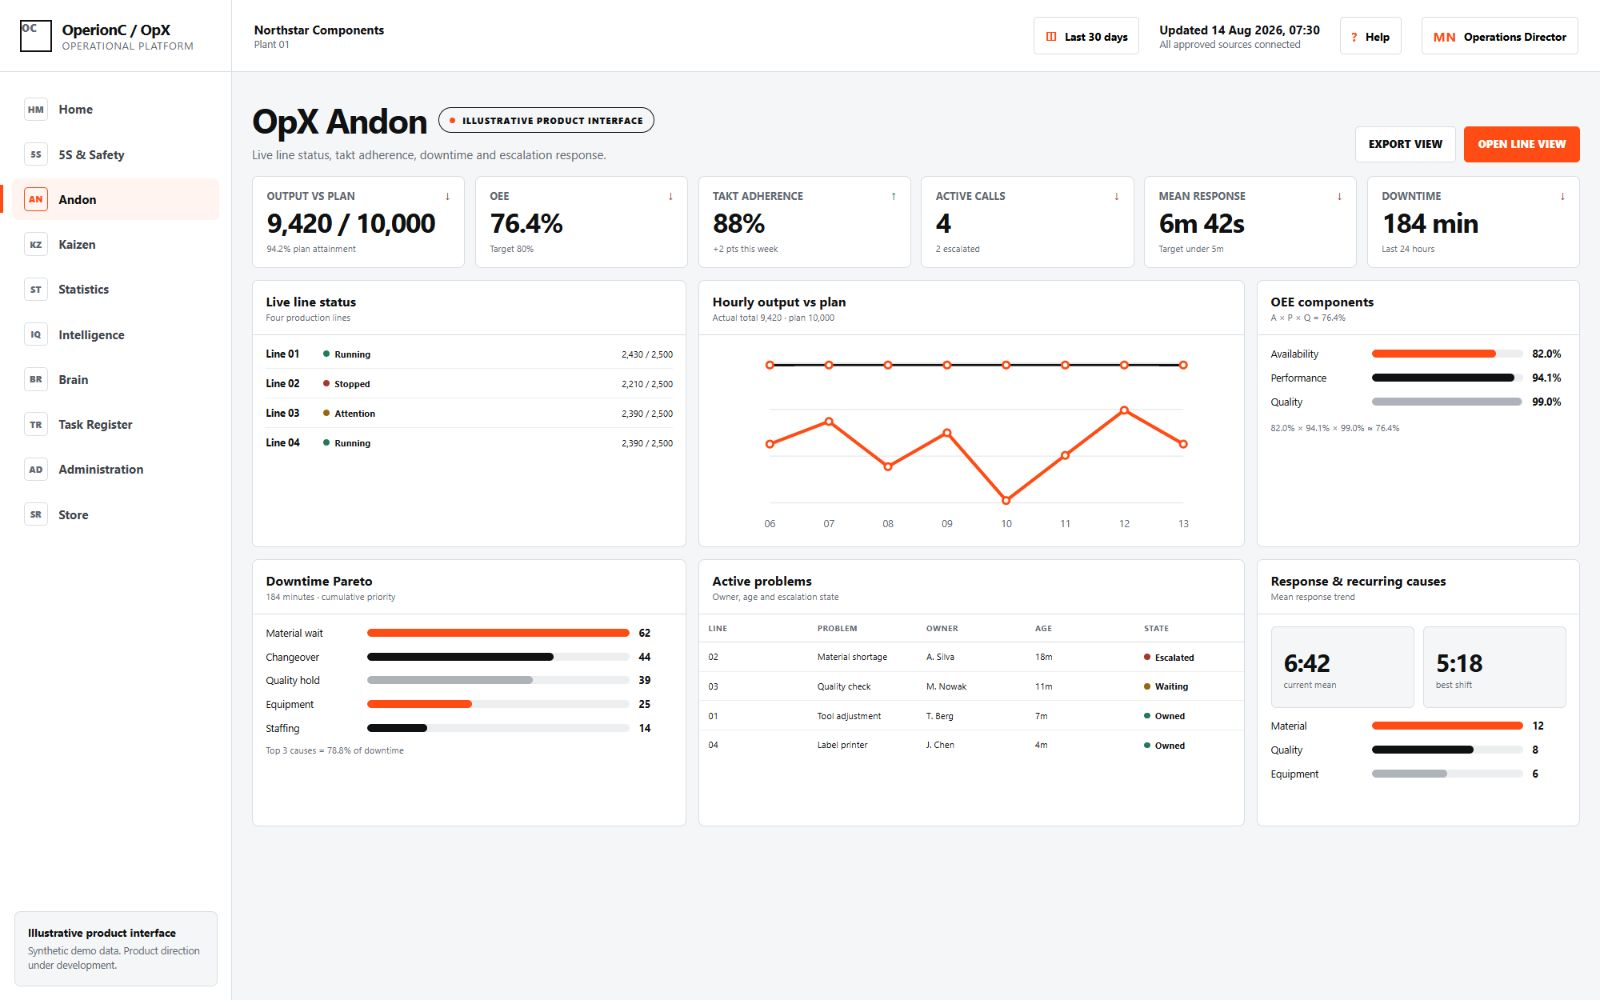
Know why the line is not delivering.
OpX Andon shows plan vs. actual, takt adherence, active calls, przestoje reasons and Pareto of recurring problems — without a complex MES implementation.
The shopfloor visibility problem
Manual assembly lines often miss plan before leaders understand what the line was waiting for.
Late information
Problems are known by operators first, but managers often see them after the shift.
No simple history
Stops, shortages and quality issues are discussed verbally instead of becoming structured improvement data.
How it works
Pair devices. Press buttons. See the line.
Admin configures lines and stations. Phones become station terminals. LCD dashboards show takt, output and active problems in real time.
Business value
From escalation to improvement data.
Optional Integration Hub: OpX can be connected with existing ERP, SAP, MES or local reporting systems through CSV/XLSX exports, REST API, webhooks or dedicated integration projects.
Simple deployment
No complex MES required to start.
Operator presses Brak materiału.
LCD shows active call and timer immediately.
Lider sees line status, output and open problems.
Faster reaction before the shift result is lost.
Weekly report summarizes przestoje and Pareto.
Data supports zarządzanie dzienne and improvement priorities.
Make line problems visible in real time.
Start with phones and one screen. Build structured loss data before investing in complex systems.